
Economic Cycle
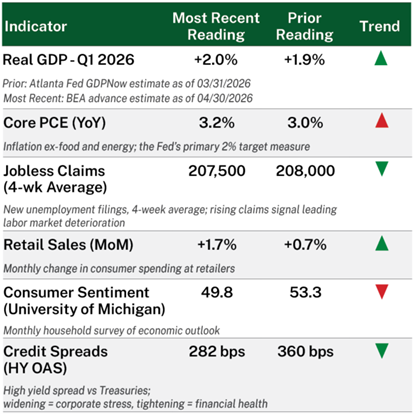
April’s economic backdrop was shaped largely by geopolitical developments, as the conflict with Iran pushed energy prices higher and complicated what had been a gradual path toward lower inflation. The move in oil was meaningful enough to affect policy expectations, with markets moving to price in fewer and later rate cuts from the Federal Reserve.
While higher energy prices added inflationary pressure, underlying economic activity remained relatively resilient. The labor market continued to show stability (if not growth) and consumer spending held up, even as momentum moderated in select discretionary areas.
Sentiment, however, weakened notably during the month. Consumer confidence declined toward recent lows, reflecting increased concern around energy costs and geopolitical uncertainty. The gap between softer sentiment and still-solid hard data remains a defining and unique feature of the current economic environment.
Equity Markets
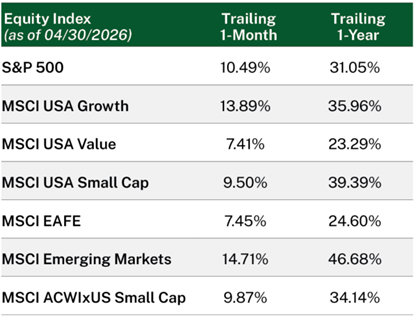
Equity markets rebounded sharply in April, with the S&P 500 posting its best monthly return since November 2020. Investor focus returned to a fundamentally strong earnings backdrop, with technology and AI-related names driving an outsized share of returns. These companies are also doing much of the heavy lifting on the earnings front, contributing a disproportionate share of S&P 500 earnings growth, which is on pace for another quarter of double-digit gains.
Value and small cap stocks participated but lagged over the month. Energy was a notable detractor, pulling back after a strong start to the year as oil prices moderated from their earlier highs. Internationally, dollar weakness provided a broad tailwind, with emerging markets outpacing developed peers on the strength of AI-linked technology and semiconductor exposure across Asia.
Fixed Income Markets
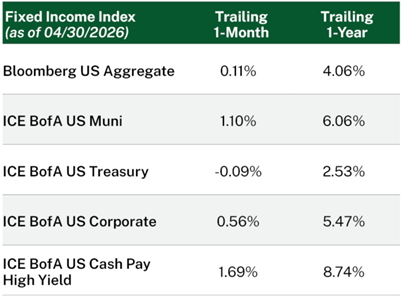
Fixed income markets were shaped by two opposing forces in April. Treasury yields moved higher amid firm inflation expectations and a shift toward fewer and later rate cuts, while credit spreads narrowed meaningfully. The net result was a broadly unchanged market for the month.
The Federal Reserve held rates steady, with a dissenting minority within the committee signaling that any move toward easing remains a more distant prospect than markets had anticipated entering the year.
High yield was the standout performer, benefiting from spread tightening and reflecting the same risk appetite seen in equity markets. Investment grade and municipals lagged, weighed down by their longer duration profiles.
Our Perspective
April demonstrated how powerfully corporate fundamentals can anchor markets even when the broader backdrop remains unsettled. Despite unresolved geopolitical conflict, stubborn inflation, and early signs of softening in the labor market, equities continued to rally on the strength of growing corporate profits. Our outlook on equities remains favorable across a range of market segments. The volatility earlier in the year created a valuation reset that we view as presenting compelling longer-term opportunities, particularly in areas most affected by the selloff.
In fixed income, tight credit spreads call for a selective approach to credit exposure, while still allowing investors to earn reasonably attractive yields in higher quality segments of the market.
While April saw a return to risk-on sentiment and some narrowing of market leadership, we continue to believe the strength of underlying fundamentals will drive meaningfully different outcomes across market segments in the period ahead.
Monthly Recommendation
1929: Inside the Greatest Crash in Wall Street History – and How it Shattered a Nation by Andrew Ross Sorkin is a rare example of an historical account that makes the reader feel like you intimately know, and deeply care about, the real people involved. The book provides not only a detailed and nuanced account of the lead-up to and aftermath of the title event itself, but more poignantly paints a vivid picture of the cultural and economic mindset of an era that feels completely foreign to the modern world and yet carries an unnerving degree of familiarity.
All investments contain risk and may lose value. This material contains the opinions of Manning & Napier, which are subject to change based on evolving market and economic conditions. This material has been distributed for informational purposes only and should not be considered as investment advice or a recommendation of any particular security, strategy or investment product. Information contained herein has been obtained from sources believed to be reliable but not guaranteed.
Indicator Sources: Atlanta Fed GDPNow — Q1 prior reading (atlantafed.org) | Bureau of Economic Analysis (BEA) — Q1 Real GDP estimate & Core PCE (bea.gov / fred.stlouisfed.org) | Department of Labor (DOL) Jobless Claims (fred.stlouisfed.org) | Census Bureau Retail Sales (census.gov) | University of Michigan Surveys of Consumers (sca.isr.umich.edu) | ICE BofA High Yield Option-Adjusted Spread (OAS) (fred.stlouisfed.org)
Index Disclosures: Unless otherwise noted, index returns do not reflect any fees or expenses and are provided by Morningstar, Inc. Index data referenced herein is the property of each index sponsor (S&P Dow Jones Indices LLC, a division of S&P Global Inc. (“S&P”), Bloomberg Finance L.P. (“Bloomberg”), ICE Data Indices, LLC (“ICE Data”), and MSCI), their affiliates (“Index Sponsors”) and/or their third-party suppliers and has been licensed for use by Manning & Napier. The Index Sponsors and their third-party suppliers accept no liability in connection with its use. Data provided is not a representation or warranty, express or implied, as to the ability of any index to accurately represent the asset class or market sector that it purports to represent and none of these parties shall have any liability for any errors, omissions, or interruptions of any index or the data included therein. For additional disclosure information, please see: https://go.manning-napier.com/benchmark-provisions.
The S&P 500 Total Return Index is an unmanaged, capitalization-weighted measure comprised of 500 leading U.S. companies to gauge U.S. large cap equities. The index accounts for the reinvestment of regular cash dividends, but not for the withholding of taxes. The MSCI USA Value Index is designed to measure large and mid-cap US securities exhibiting overall value style characteristics. The MSCI USA Growth Index is designed to measure large and mid-cap US securities exhibiting overall growth style characteristics. The MSCI USA Small Cap Index is designed to measure the performance of the small cap segment of the US equity market. The index represents approximately 14% of the free float-adjusted market capitalization in the US. The MSCI EAFE Index is a free float-adjusted market capitalization index designed to measure large and mid-cap representation across 21 Developed Markets countries (excluding the U.S. and Canada). The MSCI Emerging Markets Index is a free float-adjusted market capitalization index that is designed to measure equity market performance of emerging markets and consists of 24 emerging market country indices outside the U.S. The MSCI ACWI ex USA Small Cap Index is designed to measure a small cap representation across 22 of 23 Developed Markets countries (excluding the U.S.) and 24 Emerging Markets countries. MSCI indices are denominated in U.S. dollars, returns are net of withholding taxes, and they assume daily reinvestment of net dividends thus accounting for any applicable dividend taxation. The Bloomberg U.S. Aggregate Bond Index is an unmanaged, market-value weighted index of U.S. domestic investment- grade debt issues, including government, corporate, asset-backed, and mortgage-backed securities, with maturities of one year or more. Index returns provided by Intercontinental Exchange (ICE). The ICE Bank of America (BofA) U.S. Municipal Securities Index tracks the performance of U.S. dollar denominated investment grade tax-exempt debt publicly issued by U.S. states, territories, and their political subdivisions. Qualifying securities must have at least one year remaining term to final maturity, at least 18 months to final maturity at the time of issuance, a fixed coupon schedule and an investment grade rating. The ICE BofA U.S. Treasury Total Return Index is an unmanaged index that measures the performance of U.S. dollar-denominated, fixed-rate securities issued by the U.S. Treasury across all maturities. The ICE BofA U.S. Corporate Total Return Index is an unmanaged index that measures the performance of U.S. dollar-denominated, investment-grade, fixed-rate corporate debt publicly issued in the U.S. domestic market. The ICE BofA U.S. Cash Pay High Yield Index tracks the performance of U.S. dollar denominated below investment grade corporate debt, currently in a coupon paying period, issued in the U.S. domestic market. Qualifying securities must have at least one year remaining term to final maturity as of the rebalancing date, at least 18 months to final maturity at the time of issuance, a fixed coupon schedule, and a minimum amount outstanding of $250 million.
Morningstar, Inc. is a global investment research firm providing data, information, and analysis of stocks and mutual funds. © Morningstar, Inc. 2026. All Rights Reserved. The information contained herein: (1) is proprietary to Morningstar and/or its content providers; (2) may not be copied, adapted or distributed; and (3) is not warranted to be accurate, complete or timely. Neither Morningstar nor its content providers are responsible for any damages or losses arising from any use of this information, except where such damages or losses cannot be limited or excluded by law in your jurisdiction. Past financial performance is no guarantee of future results.